Gas Prices

  • Subscribe to our RSS feed.
  • Twitter
  • StumbleUpon
  • Reddit
  • Facebook
  • Digg

Wednesday, 8 January 2014

A rare stock market forecast for 2014

Posted on 06:25 by Unknown

  - by New Deal democrat

I have a new post up at XE.com, commenting on recent speculation about a stock market crash vs. a pullback due to valuations in 2014, based on YoY corporate profits in 2013.
Read More
Posted in | No comments

Monday, 6 January 2014

2014 forecast: a year of deceleration

Posted on 09:00 by Unknown

  - by  New Deal democrat

My method of foecasting is pretty simple. In fact, so simple, I call it the K.I.S.S. method. Even though the LEI is the statistic most denigrated by Wall Street forecasters, it has the inconvenient habit of being right more often than the highly-paid punditocracy, especially at turning points.

Since I'm not a highly paid Wall Street pundit, I simply rely upon the LEI for the short term, and the yield curve for the longer term with the caveat of watching out for deflation. The simple fact is, with one exception, if real M1, and real M2 (less 2.5%), are positive, and the yield curve 12 months ago was positive, the economy has always been in expansion. When real money supply is negative, and the yield curve was inverted 12 months ago, the economy has always been in contraction. The exception is that the yield curve does not help to project the economy 12-16 months later if the economy at that later date is in deflation - as it was in 1930-32 and late 2008 and early 2009.

In the few years I have also learned a lot about the methods of the late Prof. Geoffrey Moore, the founder of ECRI, so I also intergrate his findings about short and long leading indicators into my forecast. 

This year the forecast methods are consistent for the first 6 months:  growth will continue.  It is in the last half of the year, and particularly in the 4th quarter, that there is more difficulty.


First of all, let’s look at two overlapping but different forecast algorithms with a time frame of approximately 6 months ahead:  the Conference Board’s Index of Leading Indicators, and ECRI’s Weekly Leading Index.

Here is a graph of the LEI via Briefing.com


And here is ECRI’s WLI via Doug Short:

Photobucket Pictures, Images and Photos

Both of these are forecasting continued growth over the next 6 months.  In fact, the LEI has actually picked up strength in the last several months.

One big difference between the two measures is that the LEI uses housing permits and starts (actually a long indicator) as a component, while the WLI uses the Mortgage Bankers’ Association’s purchase mortgage application index as a component.  After sideways movement for most of the year, housing permits unexpectedly rose strongly in October, and maintained that level in November.  On the other hand, purchase mortgage activity has made new post-recession lows due to the increases in interest rates.

One other item worth noting is that there does not appear to be any big surge in gas prices (outside of the seasonal norm) forecast, so inflation should be kept in check, so there should be no “oil price shock” to the economy.  Also, it appears that Washington plans on leaving the economy alone this year, so there will not be any new drag from austerity or, one hopes, from a refusal to pay the bills already incurred.

But the LEI and the WLI do not forecast more than about 8 months out.  For that we need to look at the long leading indicators.  There are two separate ways I look at this.  First, when the yield curve and real money supply as measured by M1 and M2 are positive (+2.5% in the case of M2), the economy has always expanded one year later (provided there is no deflation), including during the pre-WW2 era that may be more applicable to today’s economy.  By contrast, when both measures are negative, a recession has always ensued.

First of all, here is the yield curve, as measured by 10 year treasury rates minus 6 month treasury rates:

Photobucket Pictures, Images and Photos

Note that these reliably inverted (i.e., the result was negative) a year or more before the onset of each of the last three recessions (and the same is true of prior post-WW2 recessions).  As you can easily see, the yield curve has steepened considerably in the last 8 months, entirely due to the increase in yields for the 10 year Treasury note.  Provided we do not expect deflation in the final part of this year, this should mean clear sailing.

Now let’s take a look at the 4 long leading indicators identified by Professor Geoffrey Moore and at least until recently, the components of ECRI’s “long leading index.”  These are:  corporate bond yields, inverted (blue), housing permits (red), corporate profits (green), and Real M2 (orange):

Photobucket Pictures, Images and Photos

Three of the 4 of thee indicators are absolutely positive, but at the same time all 4 have decelerated, as highlighted in this next graph, which measures the YoY% change in the same items:

Photobucket Pictures, Images and Photos

Interest rates for corporate bonds have increased, meaning that indicator has turned negative.  If present trends continue, and based on the last 50 years of history, the odds are extremely good that they will, housing permits will turn negative at some point in the first half of this year.  Similarly, if their current trend continues, real M2 will also fall below +2.5% (although I emphasize that I have no data helpful as to whether M2 will or won’t).  Corporate profits are a total question mark, although we will begin to get an answer as Q4 earnings are reported over the next month or so.

Finally, here is a look at Real M1:

Photobucket Pictures, Images and Photos

This too has been decelerating, although it remains very positive.

In conclusion, unless we expect deflation (and right now I don’t), there is every reason to view the long leading indicators, under either method, as being in agreement that the economic expansion will continue through the end of 2014.

On the other hand, the deceleration of most of the indicators, and also the deceleration of the WLI, cause me to believe that the second half will be considerably weaker than the first half.  If the long leading indicators turn negative quickly enough and significantly enough, it is possible that we could enter into a recession in Q4.  Before ruling that out, I want to see how 2013 Q4 corporate profits play out, as well as the next couple of months of housing and money supply data.  But subject to that caveat – that there are mounting reasons to be concerned about 2015 – I look for continued positive readings in employment, wages, industrial production, and GDP through the year.

I can’t help noting that my contrast for decelerating growth is at odds with that of many luminaries, including Paul Krugman, Bill McBride a/k/a Calculated Risk, Muhammed el-Arian of PIMCO, and Menzie Chinn of Econbrowser.  Morgan Stanley went so far as to call the economy “ready for launch.”

My critique of these optimistic calls is what I laid out at the outset of this article:  all of these forecasts, to a greater or lesser extent, engage in coincident-trend-following.  Morgan Stanley’s note, for example, cites the coincident indicator of freight transportation, as well as the short leading indicators of the ISM survey and capex spending.  Several others take similar tacks. 

And although I have great respect for both Bill McBride and, of course, Krgthulu, both of them rely on an acceleration of the housing recovery.  For example, Krugman says, “housing is still moving forward.” 

I always caution against using the present progressive tense without extreme care when it comes to economic data.  What we know is that housing permits and starts made new highs in October, although permits pulled back slightly in November.  We also know that the trend in 2013 was of decelerating growth, as I’ve set forth above.  And nearly every other measure of housing, except for prices, has taken it on the chin.  In addition to purchase mortgage applications, pending sales just went negative YoY.

So, just as I was an outlier to the chorus of Doom beginning at the end of April 2009, I am afraid I am going to have to withhold my cheers now.  My forecast is that 2014 will be a year of decelerating growth.
Read More
Posted in | No comments

Upper 90s-100 Area Still Tough on Oil Prices

Posted on 04:00 by Unknown

With the exception of the summer driving season (roughly late May - late September), oil prices have met with still resistance in the upper 1990s/100 price area.


Read More
Posted in | No comments

Saturday, 4 January 2014

International Week in Review

Posted on 09:51 by Unknown
Last week, the big news was from the manufacturing sector, which was the primary driver of most market activity.  Here's a link.
Read More
Posted in | No comments

Weekly Indicators for Dec.30 - Jan. 2 at XE.com

Posted on 06:11 by Unknown

  - by New Deal democrat

My Weekly Indicators column is up at XE.com.  The coincident data looks good, but deceleration in the long leading indicators shows signs of spreading to short leading indicators.
Read More
Posted in | No comments

Friday, 3 January 2014

Real money supply: significant deceleration, but still positiive

Posted on 08:07 by Unknown

  - by New Deal democrat

It won't be a surprise to anyone who reads my "Weekly Indicators" column that I have something of a bifurcated outlook for the economy.  The short leading indicators have generally been very positive (and manufacturing got two excellent numbers in the past week), while the long leading indicators have cooled considerably -- but are still positive.

Real M2 is a perfect example of this issue.  It was one of Prof. Moore's original 4 long leading indicators, and was part of the LEI for several decades before being dropped a couple of years ago.

Below is a graph of real M2 since 1980.  The red line is at the level of +2.5% YoY:

Photobucket Pictures, Images and Photos

As you can see, on the one hand it has decelerated considerably from its peak about 2 1/2 years ago.  As of yesterday's New York Fed report, for the week it is at about +4.3% YoY.  Which, of course, is still comfortably above the +2.5% level below which, if it remains for a several quarter period, is necessary but not sufficient to signal an oncoming recession.  In fact, it is probably above its average level for the last 30 years.

My gut feeling is that it will continue to decelerate.  But it is just that:  a gut feeling, and nothing on which to base any hard analysis.
Read More
Posted in | No comments

Thursday, 2 January 2014

Calculated Risk and I have made a bet on housing's direction in 2014

Posted on 06:00 by Unknown

  - by New Deal democrat

Bill McBride, a/k/a The Nicest Blogger on the Internet, and I have almost always seen eye-to-eye on the matter of housing.  Both of us thought that housing was in a bubble in 2005.  Both of us thought in 2011 that housing prices would bottom in early 2012.

But we have totally different opinions about the direction of housing in 2014.

In his forecast for 2014 residential investment, CR says, "I expect growth for new home sales and housing starts in the 20% range in 2014 compared to 2013."

By contrast, several weeks ago, in a post at XE.com, I said that "If the typical past pattern is followed, we will shortly see permits running 100,000 less than one year previously."

This is quite a difference.  Bill expects sales and starts to average about 1.150 million annualized this year.  I expect that at some point permits and starts will sink under 900,000 annualized.

The difference is one in approach.  Bill's post argues from the fundamentals:
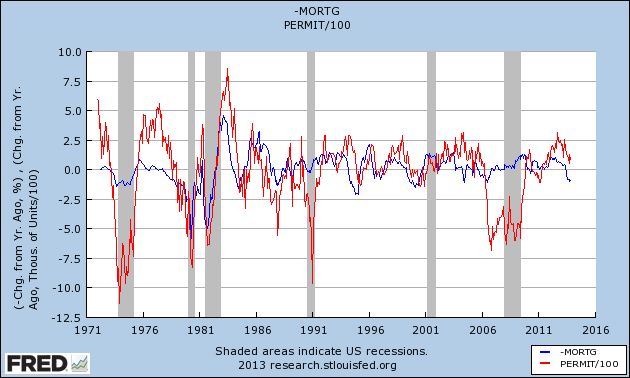
 demographics and household formation suggest starts will return to close to the 1.5 million per year average from 1959 through 2000. That means starts will come close to increasing 60% over the next few years from the 2013 level.
 From there he deduces his forecast of 20% this year.

While I agree with CR over the long term that demographics and pent-up demand are a tailwind behind the housing market, my argument stems from strong past correlations of increases in interest rates and decreases in housing demand.  The graphs I posted in the XE.com article show 15 occasions in the last 50 years that interest rates have backed up by at least 1% YoY.  On 12 of those occasions, housing permits fell by at least 100,000 shortly thereafter.  Those are pretty good odds.

When one compares mortgage rates and housing permits, as in the below graph covering the last 40 years, the relationship is even stronger:

Photobucket Pictures, Images and Photos

Of the 9 previous times in the last 40 years that mortgage rates have increased by 1% YoY, housing permits fell by at least 100,000 YoY on 8 of those occasions.  The 9th time, briefly during the bubble year of 2004, was followed by a YoY decline of -65,000 permits in spring 2005.

My working principle is to look at the data in as dispassionate and detached manner as I can, and to default to the idea that "it's not different this time."  Although permits have not even turned negative YoY at this point, their improvement has decelerated considerably since the low of interest rates in 2012.

So here are the terms of our bet:  If starts or sales are up at least 20% YoY in any month in 2014, I will make a $100 donation to the charity of Bill's choice, which he has designated as the Memorial Fund in honor of his late co-blogger, Tanta.    If housing permits or starts are down 100,000 YoY at least once in 2014, he make a $100 donation to the charity of my choice, which is the Alzheimer's Association. 

Note that since our forecasts are not mirror images of one another, it is possible that both or us will win this bet.  Or neither!  And to be honest, since my forecast implies a weakening economy, probably with less hiring and wage growth, I hope I lose.

But I think this frames the biggest US economic issue of 2014 - will the rise in interest rates derail economic growth? - in a succinct manner.


Read More
Posted in | No comments
Older Posts Home
Subscribe to: Posts (Atom)

Popular Posts

  • Median family income continued stagnation in 2012
    - by New Deal democrat Berkeley Professors Saez and Piketty have updated their work on family income in the US through 2012, making use o...
  • Initial claims last week ex-California computer glitch ~327,000
    - by New Deal democrat Computer issues in California continue to bedevil the weekly initial jobless claims reports. We can make a good es...
  • Oil Becoming Potential Major Economic Threat
    Oil is quickly becoming a potential major threat to the economy. Oil hit resistance at the 98 level five times during the first half of 2013...
  • An NDD holiday special: semi-healthy pecan pie with maple, caramel, and peanut butter
     - by New Deal democrat My mom made a  terrific pecan pie.  Unfortunately, most pecan pie recipes basically consist of corn syrup, sugar, an...
  • Weekend Weimar, Beagle and Pit Bull
    I'll be back on Monday; NDD will be here over the weekend.
  • A thought for Sunday: an undemocratically elected minority of anarchists
    - by New Deal democrat An old cynical political saw says that, "in a democracy, people get the government they deserve." As it ...
  • Why even debating breaching the debt ceiling is a Big F*g Deal: a nonpartisan note
    - by New Deal democrat Regardless of your politics, you should care very much not just whether or not we actually fail to increase the deb...
  • The Rising Yuan And Slowing Chinese Growth
    Above is a weekly chart of the yuan ETF over a three year period.  In the 2H09 and most of 2010 we see a relative level of stability, save f...
  • No Commodity Based Inflation in the Works
    Above is a weekly chart of the overall commodity index for the last three years.  While heavily weighted towards oil, other commodities are ...
  • 2014 forecast: a year of deceleration
       - by  New Deal democrat My method of foecasting is pretty simple. In fact, so simple, I call it the K.I.S.S. method. Even though the LEI ...

Categories

  • Australia
  • Auto
  • Brazil
  • Canada
  • Chile
  • China
  • CPI
  • employment
  • Europe
  • GDP
  • Germany
  • India
  • Investment
  • ism manufacturing
  • ISM Service
  • Japan
  • Mexico
  • PCE
  • Peru
  • PPI
  • UK

Blog Archive

  • ▼  2014 (7)
    • ▼  January (7)
      • A rare stock market forecast for 2014
      • 2014 forecast: a year of deceleration
      • Upper 90s-100 Area Still Tough on Oil Prices
      • International Week in Review
      • Weekly Indicators for Dec.30 - Jan. 2 at XE.com
      • Real money supply: significant deceleration, but ...
      • Calculated Risk and I have made a bet on housing's...
  • ►  2013 (293)
    • ►  December (54)
    • ►  November (38)
    • ►  October (58)
    • ►  September (79)
    • ►  August (64)
Powered by Blogger.

About Me

Unknown
View my complete profile