Gas Prices

  • Subscribe to our RSS feed.
  • Twitter
  • StumbleUpon
  • Reddit
  • Facebook
  • Digg

Tuesday, 24 September 2013

Germany Heading In The Right Direction

Posted on 08:30 by Unknown
From the latest Markit press release:

Output growth accelerated for the fourth month running in September, helped by a further upturn in new orders, which highlighted that the German private sector economy gained further momentum at the end of the third quarter. Meanwhile, net job creation returned in September and, although only marginal, the pace of employment expansion was the most marked since March 2012.
 

At 53.8 in September, up from 53.5 in August, the seasonally adjusted Markit Flash Germany Composite Output Index pointed to a solid rise in business activity, with the pace of expansion the fastest since January. The index has now posted above the neutral 50.0 threshold for five months in a row.

And business confidence is also picking up:


Let's see how this information is effecting the markets.


First, Europe in general is rallying.  The IEVs broke through resistance at 43 several weeks ago and continued to move higher.  The shorter EMAs are rising and providing technical support for the move higher.  Momentum overall is positive.


The German ETF is in a slow uptrend, printing continually higher highs (see arrows at 25, 26 and 27).  The 200 day EMA is providing long-term support for the rally.  Momentum is ebbing and flowing but staying in a positive range. 
Read More
Posted in Germany | No comments

New Home Sales Stalling Under Higher Rates

Posted on 04:30 by Unknown
One of the bright spots for the US economy has been a rebounding housing market.  Depressed for the last four years as it worked off the massive excess of the housing bubble, the market has recently been rebounding.  Let's look at the data to see exactly what's been happening as of late.


New home sales dropped sharply in the latest report.  In addition, recent economic activity was revised lower.  While one month of data is too little data on which to draw a conclusion, anecdotal reports from several sources have indicated the recent increase in rates in having a negative effect on purchasers.


The above chart shows the numbers for housing permits in blue) and housing starts (in red) for the last year.  The numbers have been cresting.  However,


Placed in a larger context, we see that housing starts and permits, after rising since the beginning of 2011, are moving slightly lower.  This, again, is most likely due to the effects of higher rates.


Read More
Posted in | No comments

Monday, 23 September 2013

Comments Are Off Until DAN KENNEDYS LIFESTYLE LIBERATION BLUEPRINT STOPS SPAMMING OUR BLOG

Posted on 16:52 by Unknown
For the last 24 hours, Dan Kennedy's Lifestyle Liberation Blueprint has been spamming our comments section.  So, until this utterly worthless website, whose content we do not endorse stops attempting to promote their worthless and contemptible site on our blog, comments will be off.

Read More
Posted in | No comments

Chinese Rebound Continues

Posted on 11:30 by Unknown
There was a great deal of concern among economists and market participants earlier this year over China, or, more specifically, the then emerging slowdown in the Chinese economy.  However, recent data indicates the slowdown has passed. 

From the latest HSBC report:

Here's a chart of the Chinese market:


The market dropped sharply in June, falling to ~1950 with an intra-day move down to 1850.  However, prices have been moving steadily higher since then, crossing the 200 day EMA the week before last.  Last week's large daily sell-off looks as must technical as anything else.
Read More
Posted in | No comments

Oil Is Still At High Levels

Posted on 08:30 by Unknown

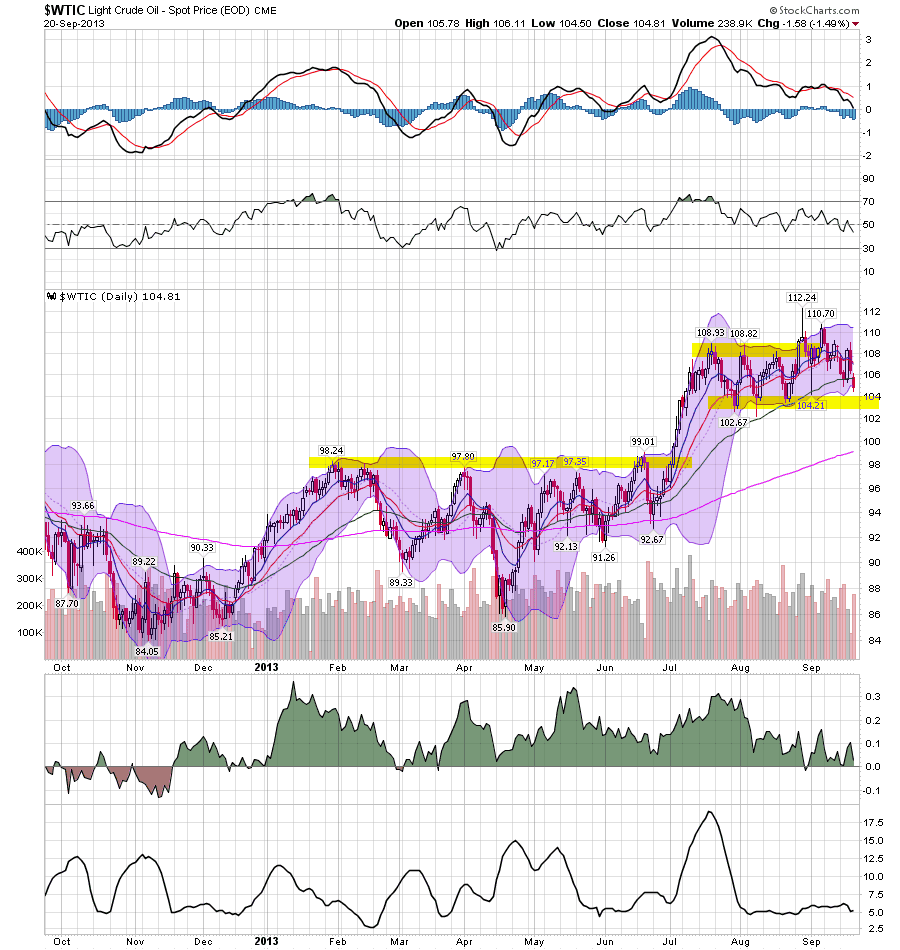
Oil has been trading at high level (over the 102/104 area) for almost two months.  While the chart is telling us that a sell-off is on the way (dropping MACD, weakening CMF, prices below all the shorter EMAs) we're not there yet. 
Read More
Posted in | No comments

Economic/Market Analysis: US

Posted on 04:00 by Unknown
The best news of the week came from the Conference Boards LEI and CEI release:

The Conference Board LEI for the U.S. increased in August for the second consecutive month. The improvement in the LEI was driven by positive contributions from the interest rate spread, ISM® new orders, average workweek and lower initial claims for unemployment. In the six-month period ending August 2013, the leading economic index increased 2.1 percent (about a 4.3 percent annual rate), marginally faster than the growth of 2.0 percent (about a 4.1 percent annual rate) during the previous six months. In addition, the strengths among the leading indicators have been more widespread than weaknesses in recent months.

The Conference Board CEI for the U.S., a measure of current economic activity, also improved in August. The index rose 0.9 percent (about a 1.9 percent annual rate) between February and August 2013, slower than the growth of 1.2 percent (about a 2.3 percent annual rate) for the previous six months. However, the strengths among the coincident indicators have remained very widespread, with all components advancing over the past six months. The lagging economic index continued to increase, but at a higher rate than the CEI. As a result, the coincident-to-lagging ratio is down slightly. Real GDP expanded at a 2.5 percent annual rate in the second quarter of the year, after increasing 1.1 percent (annual rate) in the first quarter.

Here's a table of the last 6 months of readings:

One of my concerns with this data series over the last few months has been its weakening internal condition, as a larger number of the individual data points printed in the negative.  Last month, the only negative reading came from building permits.

The housing market also provided us with important information.  First, existing home sales increased 1.7% with 4.9 months of inventory available.  The good news here is that sales keep increasing, but we're also seeing an uptick in inventories, which will eventually help to ease price increases.  Housing starts increased .9%.  While this number is positive, it's been stabilizing at current levels for the last several months.  I'll have more on this later this week.  Finally, the NAHB homebuilders index was unchanged at 58.   

Last week there was a ton of information released on the industrial sector, starting with the .4% increase in industrial production.  The increase was broad-based, with all sectors save utility output expanding.  Capacity utilization also increased, but remember that its level is still below pre-recession peaks. The Empire State manufacturing index decreased, but still printed a positive number at 6.3.  This number has been fairly weak for most of the year.  In contrast was the Philly Fed manufacturing index, which increased strongly, moving from 9.3 to 22.3.  New orders and shipments also increased sharply.  The balance of the IP news (which is a coincident economic indicator) was positive.

The overall tenor of the news this week was positive.  It appears the manufacturing sector is trying to advance beyond its recent doldrums.  Housing is slowing, but that would be a logical development considering the increased rate environment we are now seeing.  I wouldn't be surprised to see the industry eventually pause at current levels of activity as a result of higher interest rates.  Finally, the LEIs were a welcome development as they indicate forward economic momentum is occurring.

Let's turn to the markets.


There's good and bad news on the SPY chart.  The good news is it printed a new high last week, the third in a successive period of higher highs (see the 167 print in May, 170 in early August and 172 last week).  However, notice the rate of increase (the arcing blue line above prices) is becoming less steep, indicating momentum is decreasing.  I'm beginning to think we're going to end the year close or slightly above current levels.


Last week we saw both the belly of the curve (IEFs, top chart) and long end (TLTs, bottom chart) rally in reaction to the Fed announcing it won't taper this month.  But both of these are temporary aberrations.  While there will be no tapering this month, it is sure to happen at some time with the likely occurrence being sooner rather than later.  As such, the real issue for the above ETFs is whether support holds at current levels.


Read More
Posted in | No comments

Saturday, 21 September 2013

Weekly Indicators: Aroma's Coffeehouse edition

Posted on 07:30 by Unknown

 - by New Deal democrat

This week's edition of Weekly Indicators is coming to you from one of my favorite places in the whole world, Aroma's Coffeehouse in Colonial Williamsburg.


Month over month August data included the Index of Leading Economic Indicators, up strongly, suggesting good growth for the next 6 to 8 months. Industrial production improved to a post-recession high, capacity utilization was up, the Philly manufacturing index improved, although the Empire State index decelerated. Existing home sales were up. Consumer prices barely budged. A big negative was the decline in housing starts and permits.

Let's again start this edition of the high frequency weekly indicators by looking at the real economic version of the Dow signal, i.e., comparing manufacturing with transport:

Steel production from the American Iron and Steel Institute
  • -1.3% w/w

  • +5.3% YoY

Steel production over the last several years has been, and appears to still be, in a decelerating uptrend. It had been negative YoY, but turned positive one week ago.

Transport

Railroad transport from the AAR
  • +8300 carloads up +1.5% YoY

  • +12,700 carloads or +7.7% ex-coal

  • +13,300 or +4.9% intermodal units

  • +17,300 or +3.1% YoY total loads
Shipping transport
  • Harpex down -3 to 403

  • Baltic Dry Index up +268 to 1904
Rail transport had been both positive and negative YoY during midyear, but this week was the sixth positive week in a row since then, and equals its most positive showing in a long time. The Harpex index had been improving slowly from its January 1 low of 352, but has generally flattened out for the last few months. The Baltic Dry Index has rebounded to make nearly a 2 year high. In the larger picture, both the Baltic Dry Index and the Harpex declined sharply since the onset of the recession, and have been in a range near their bottom for about 2 years, but stopped falling earlier this year, and now seem to be in an uptrend.

Employment metrics

Initial jobless claims
  • 309,000 up +17,000

  • 4 week average 314,750 down -6500

The American Staffing Association Index was up 1 98. It is up +5.1% YoY

Tax Withholding
  • $111.2 B for the first 13 days of September vs. $99.5 B last year, up +11.7 B or +11.8%

  • $148.5 B for the last 20 reporting days vs. $134.0B last year, up +14.5 B or +10.8%

We can now estimate that after adjusting for state reporting glitches, one week ago initial jobless claims were ~318,000, still a 6 year low. Jobless claims remain firmly in a normal expansionary mode. Like each of the last three years that this same, a good, downside breakout has occurred.

Temporary staffing had been flat to negative YoY in spring, but has broken out positively in the last two months. Tax withholding, after a relatively poor August, is again posting better comparisons.

Consumer spending
  • ICSC -1.6% w/w +3.2% YoY

  • Johnson Redbook +3.4% YoY

  • Gallup daily consumer spending 14 day average at $81 up $9 YoY
Gallup's 14 day average of consumer spending is positive, but significantly less so than earlier this year. The ICSC varied between +1.5% and +4.5% YoY in 2012, while Johnson Redbook was generally below +3%. The ICSC has been weakening but improved for the second week in a row, and Johnson Redbook remains at the high end of its range, and has actually been improving.

Oil prices and usage
  • Oil down -3.46 to $104.75 w/w

  • Gas down -$0.04 at $3.55 w/w

  • Usage 4 week average YoY down +0.6%
The price of Oil continued its retreat from its recent 2 year high. The 4 week average for gas usage turned slightly positive, after two weeks of being slightly negative.

Interest rates and credit spreads
  • 5.54% BAA corporate bonds up +0.05%

  • 2.92% 10 year treasury bonds unchanged

  • 2.57% credit spread between corporates and treasuries up -+0.05%
Interest rates for corporate bonds had been falling since being just above 6% in January 2011, hitting a low of 4.46% in November 2012. Treasuries fell to a possible once-in-a-lifetime low of 1.47% in July 2012, and have decisively risen about 1.5% above that mark. Spreads, however, made another new 2 year low this week. Their recent high was over 3.4% in June 2011.

Housing metrics

Mortgage applications from the Mortgage Bankers Association:
  • +3% w/w purchase applications

  • +1% YoY purchase applications

  • +18% w/w refinance applications
Refinancing applications have decreased sharply in the last 4 months due to higher interest rates, although this week's rebound makes up almost all of last week's precipitous decline. Purchase applications have also declined from their multiyear highs in April, but are still ever so slightly up YoY.

Housing prices
  • YoY this week +11.1%
Housing prices bottomed at the end of November 2011 on Housing Tracker, and averaged an increase of +2.0% to +2.5% YoY during 2012. This weeks's YoY increase remains near a 7 year record.

Real estate loans, from the FRB H8 report:
  • unchanged w/w

  • -0.1% YoY

  • +1.2% from its bottom
Loans turned up at the end of 2011 and averaged about 1% gains YoY through most of 2012.  Over the last few months, the comparisons have completely stalled.

Money supply

M1
  • -0.8% w/w

  • -0.2% m/m

  • +5.7% YoY Real M1

M2
  • unchanged w/w

  • +0.2% m/m

  • +5.0% YoY Real M2
Real M1 made a YoY high of about 20% in January 2012 and decelerated since then. Earlier this year it increased again but this week made a new 2 year low (although it is still positive).  Real M2 also made a YoY high of about 10.5% in January 2012.  Its subsequent low was 4.5% in August 2012. It increased slightly in the first few months of this year, then stabilized, but has declined again in the past several months.

Bank lending rates
  • 0.246 TED spread up +0.002% w/w

  • 0.179 LIBOR down -0.002 w/w
The TED spread is still near the low end of its 3 year range, although it has risen slightly in the last few months.  LIBOR established yet another new 3 year low this week.

JoC ECRI Commodity prices
  • up 1.22 to 124.75 w/w

  • -0.13 YoY

This week was generally positive, with the same concerns about the long leading indicators as I've had for the past several months. Interest rates are negative, mortgage applications and real estate loans have turned negative, and now even purchase mortgage applications are just barely positive YoY, and money supply is decelerating although still positive. Spreads between corporate bonds and treausries also were negative this week.

The shorter leading indicators of initial jobless claims are positive, even adjusting for California's computer problems. Temporary employment has turned strongly positive in the last two months. The oil choke collar is engaged but has eased off, especially as to gasoline. Commodities are neutral.

The coincident indicators once again look like they have broken out positively. Rail traffic, which had been a real concern, has broken to the upside strongly, as has shipping. Steel production is positive. Consumer spending is holding up reasonably well. Bank lending rates are at or near or at record lows. Tax withholding has also improved moderately in the last couple of weeks. House prices remain strongly positive.

Once again this week the story remains, if Washington can avoid destroying things, the economy appears ready to pick up steam again for the rest of the year. I still remain much more cautious about 2014. .


[my motto]

Have a nice weekend!
Read More
Posted in | No comments
Newer Posts Older Posts Home
Subscribe to: Posts (Atom)

Popular Posts

  • Sorry, Doomers, there really, truly, honestly, STILL is no second US housing bubble
     - by New Deal democrat The Census Bureau released September and October new home sales  and median new house price data this morning, and t...
  • Weekly indicators: consumer spending breaks on through to the other side edition
     - by New Deal democrat This may have been the slowest week for monthly data ever. The only item of note was the ISM services report, whic...
  • A rare stock market forecast for 2014
      - by New Deal democrat I have a new post up  at XE.com , commenting on recent speculation about a stock market crash vs. a pullback due to...
  • 2014 forecast: a year of deceleration
       - by  New Deal democrat My method of foecasting is pretty simple. In fact, so simple, I call it the K.I.S.S. method. Even though the LEI ...
  • International Week in Review
    Last week, the big news was from the manufacturing sector, which was the primary driver of most market activity.   Here's a link.
  • Real money supply: significant deceleration, but still positiive
      - by New Deal democrat It won't be a surprise to anyone who reads my "Weekly Indicators" column that I have something of a b...
  • Employment Slack Gives Central Banks Plenty of Room to Keep Rates Low
    This is up over at XE.com.
  • A thought for 2013: The Progressive Economic Case is still Equality, not Armageddon
      - by New Deal democrat Six years ago I posted an essay on Daily Kos entitled  The Progressive Economic Case: Inequality,not Armageddon .  ...
  • The Rising Yuan And Slowing Chinese Growth
    Above is a weekly chart of the yuan ETF over a three year period.  In the 2H09 and most of 2010 we see a relative level of stability, save f...
  • Great idea. Now how do we pay for it?
     - by New Deal democrat Franklin Delano Roosevelt was a political genius. He deliberately designed Social Security as a social insurance pro...

Categories

  • Australia
  • Auto
  • Brazil
  • Canada
  • Chile
  • China
  • CPI
  • employment
  • Europe
  • GDP
  • Germany
  • India
  • Investment
  • ism manufacturing
  • ISM Service
  • Japan
  • Mexico
  • PCE
  • Peru
  • PPI
  • UK

Blog Archive

  • ▼  2014 (7)
    • ▼  January (7)
      • A rare stock market forecast for 2014
      • 2014 forecast: a year of deceleration
      • Upper 90s-100 Area Still Tough on Oil Prices
      • International Week in Review
      • Weekly Indicators for Dec.30 - Jan. 2 at XE.com
      • Real money supply: significant deceleration, but ...
      • Calculated Risk and I have made a bet on housing's...
  • ►  2013 (293)
    • ►  December (54)
    • ►  November (38)
    • ►  October (58)
    • ►  September (79)
    • ►  August (64)
Powered by Blogger.

About Me

Unknown
View my complete profile