Gas Prices

  • Subscribe to our RSS feed.
  • Twitter
  • StumbleUpon
  • Reddit
  • Facebook
  • Digg

Monday, 30 September 2013

Market/Economic Analysis: US

Posted on 04:00 by Unknown
Last week, we received a broad swath of information on the US economy, starting with the third and final GDP statement for 2Q13.  According to the BEA:

Real gross domestic product -- the output of goods and services produced by labor and property located in the United States -- increased at an annual rate of 2.5 percent in the second quarter of 2013 (that is, from the first quarter to the second quarter), according to the "third" estimate released by the Bureau of Economic Analysis. In the first quarter, real GDP increased 1.1 percent.
.....
The increase in real GDP in the second quarter primarily reflected positive contributions from personal consumption expenditures (PCE), exports, nonresidential fixed investment, private inventory investment, and residential fixed investment that were partly offset by a negative contribution from federal government spending. Imports, which are a subtraction in the calculation of GDP, increased.

There was a relatively broad amount of improving data -- PCEs, business investment and exports all contributed to the increase.  As has been typical of the last four quarters, federal government spending contractions were responsible for the negative contributions.  Overall, it was a fair report with the primary problem being the lack of +3% top line growth.

We also learned that personal income increased as well:

Personal income increased $57.2 billion, or 0.4 percent, and disposable personal income (DPI) increased $56.2 billion, or 0.5 percent, in August, according to the Bureau of Economic Analysis. Personal consumption expenditures (PCE) increased $34.5 billion, or 0.3 percent. In July, personal income increased $21.2 billion, or 0.2 percent, DPI increased $32.7 billion, or 0.3 percent, and PCE increased $18.3 billion, or 0.2 percent, based on revised estimates. 

Real disposable personal income increased 0.3 percent in August, compared with an increase of 0.2 percent in July. Real PCE increased 0.2 percent, compared with an increase of 0.1 percent.

Real DPI has increased at modest rates over the last few months, another encouraging sign.

The Chicago Fed National Activity Index (FCNAI) "increased" from -.18 to -.14, indicating the US economy is expanding below its potential.  The index has been printing negative numbers for the last six months.

We had four manufacturing related numbers come out last week.  First, Markit's US number printed at 52.8, down from 53.1.  While output and new orders were both positive, new export orders came in below a reading of 50,  indicating a contraction.  This is only one month of data however, meaning we should keep an eye on it for the time being.  The Richmond Fed's manufacturing index dropped to 0, while the internal readings for new orders and production also fell sharply.  The Kansas City Fed manufacturing survey came in at 2, which compares to readings of 8 for August and 6 for July.  Finally, new orders for durable goods increased .1% last month.  Looking at the number ex-transports, we see increases of .1, -.5 and -.1 for the last three months, which indicate some weakness. 

We also had two data points from the housing market.  First, the Census Bureau reported that:

Sales of new single-family houses in August 2013 were at a seasonally adjusted annual rate of 421,000, according to estimates released jointly today by the U.S. Census Bureau and the Department of Housing and Urban Development. This is 7.9 percent (±14.6%)* above the revised July rate of 390,000 and is 12.6 percent (±15.3%)* above the August 2012 estimate of 374,000.

Secondly, the Case Shiller home price index reported the 20 city average of home prices increased 1.84% M/M and 12.29% for the last 12 months.

Conclusion: at the macro level, the US economy is still growing and generating income growth, although at weak levels.  However, these levels are consistent with numbers we've been seeing for the duration of this recovery.  Manufacturing is still expanding, although some of the numbers from the regional surveys indicate some short-term weakness.  Housing continues to improve and, most importantly, consumers seem to be getting used to the higher interest rates on loans.

Let's turn our attention to the markets:


The 60 minute SPY chart shows that last week's price action was simply a sell-off from the rally that lasted from the end of August through mid-September.  Momentum is weak and there isn't much volume flow into the market.


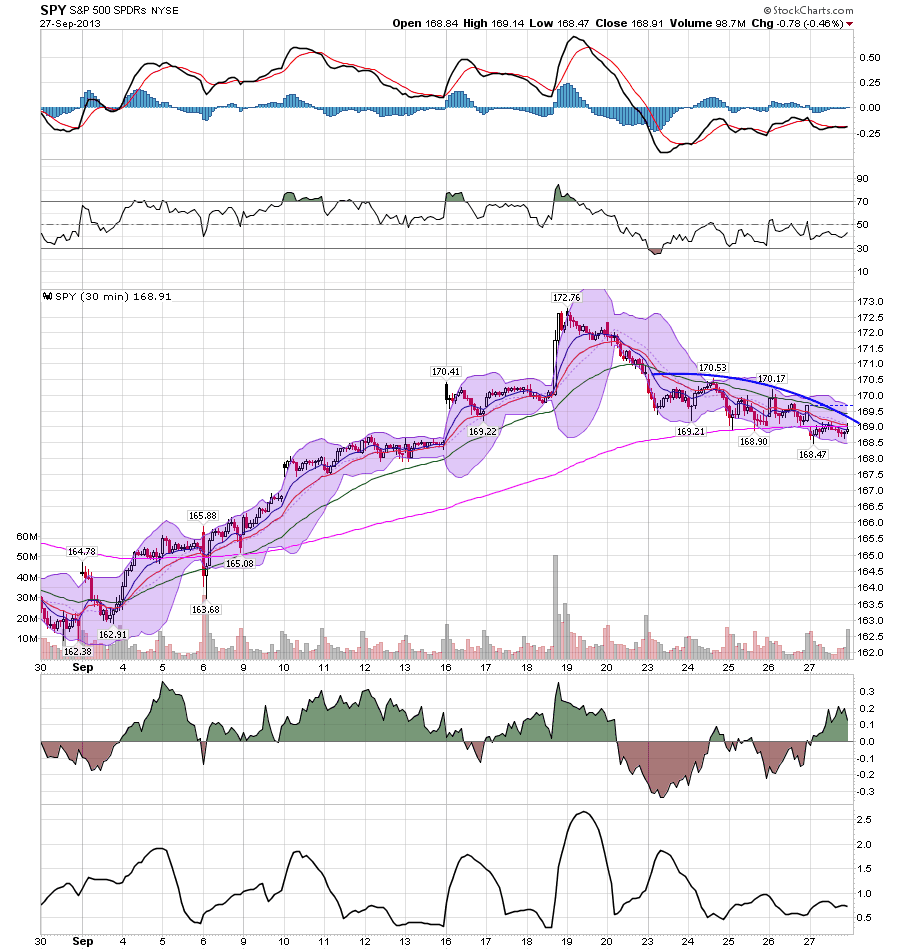
The 30 minute chart shows the heavy technical damage was done at the end of the week of September 10-23; last week's price action was really more of a gentle move lower.


Remember that on the daily chart, we have two somewhat bearish trends in play.  The first is a weakening of momentum; note the decrease in the MACD's highs over the last 3-4 months.  Second, the price arc is moving a bit more sideways now rather than printing an increase.


There are two technical events occurring in the long end of the treasury market.  The first was the sell-off caused by the Fed's taper announcement.  Here we see prices drop from 123 to 101 (a drop of about 18%) which included a move through the technically important 113 and 105-106 level.  Since then prices have "rallied" and are looking for a natural upside resistance point.  But remember that this is a technical bounce, nothing more.

Email ThisBlogThis!Share to XShare to Facebook
Posted in | No comments
Newer Post Older Post Home

0 comments:

Post a Comment

Subscribe to: Post Comments (Atom)

Popular Posts

  • Median family income continued stagnation in 2012
    - by New Deal democrat Berkeley Professors Saez and Piketty have updated their work on family income in the US through 2012, making use o...
  • Initial claims last week ex-California computer glitch ~327,000
    - by New Deal democrat Computer issues in California continue to bedevil the weekly initial jobless claims reports. We can make a good es...
  • Oil Becoming Potential Major Economic Threat
    Oil is quickly becoming a potential major threat to the economy. Oil hit resistance at the 98 level five times during the first half of 2013...
  • An NDD holiday special: semi-healthy pecan pie with maple, caramel, and peanut butter
     - by New Deal democrat My mom made a  terrific pecan pie.  Unfortunately, most pecan pie recipes basically consist of corn syrup, sugar, an...
  • Weekend Weimar, Beagle and Pit Bull
    I'll be back on Monday; NDD will be here over the weekend.
  • A thought for Sunday: an undemocratically elected minority of anarchists
    - by New Deal democrat An old cynical political saw says that, "in a democracy, people get the government they deserve." As it ...
  • Why even debating breaching the debt ceiling is a Big F*g Deal: a nonpartisan note
    - by New Deal democrat Regardless of your politics, you should care very much not just whether or not we actually fail to increase the deb...
  • The Rising Yuan And Slowing Chinese Growth
    Above is a weekly chart of the yuan ETF over a three year period.  In the 2H09 and most of 2010 we see a relative level of stability, save f...
  • No Commodity Based Inflation in the Works
    Above is a weekly chart of the overall commodity index for the last three years.  While heavily weighted towards oil, other commodities are ...
  • 2014 forecast: a year of deceleration
       - by  New Deal democrat My method of foecasting is pretty simple. In fact, so simple, I call it the K.I.S.S. method. Even though the LEI ...

Categories

  • Australia
  • Auto
  • Brazil
  • Canada
  • Chile
  • China
  • CPI
  • employment
  • Europe
  • GDP
  • Germany
  • India
  • Investment
  • ism manufacturing
  • ISM Service
  • Japan
  • Mexico
  • PCE
  • Peru
  • PPI
  • UK

Blog Archive

  • ►  2014 (7)
    • ►  January (7)
  • ▼  2013 (293)
    • ►  December (54)
    • ►  November (38)
    • ►  October (58)
    • ▼  September (79)
      • ECRI recession call: unhappy two year anniversary
      • Market/Economic Analysis: US
      • 'Breaking Bad' finale predictions
      • Leave comments here
      • A thought for Sunday: an undemocratically elected ...
      • Weekly Indicators: are consumers voting agains...
      • Weekend Weimar, Beagle and Pit Bull
      • Japan Continues To See Inflationary Increase
      • Europe Catching a Bid
      • The economy has almost completely recovered (the p...
      • India Raises Rates 25 BP
      • Making Sense of the Durable Goods Numbers
      • Initial claims last week ex-California computer gl...
      • What Happened to the Perp Walk?
      • UK Economy Continues To Look Promising
      • Gas price trend nears its best in a decade
      • In case you were wondering . . .
      • Employment Burns While Washington Fiddles
      • Corporate Bond Market Selling Off With Treasury Ma...
      • Germany Heading In The Right Direction
      • New Home Sales Stalling Under Higher Rates
      • Comments Are Off Until DAN KENNEDYS LIFESTYLE LIBE...
      • Chinese Rebound Continues
      • Oil Is Still At High Levels
      • Economic/Market Analysis: US
      • Weekly Indicators: Aroma's Coffeehouse edition
      • Weekend Weimar, Beagle and Pit Bull
      • American Manufacturing is Resurgent -- Thanks to A...
      • Gold's Long Term Trend Is Still Down
      • Why do Doomers hate Supertrains?
      • Initial jobless claims likely ~318,000 last week e...
      • Ben Blames Congress
      • Despite Market Sell-Off Chile Is Still Attractive
      • Recent Indian Bounce Looks Purely Technical
      • Housing decline is cause for concern, but no red flag
      • The Non-Existent Inflationary Threat
      • Higher Rates Hitting Homebuyers
      • Peru Still Attractive As An Investment
      • Industrial Sector and Copper Relationship Broken
      • OECD Developed Market LEIs Increasing
      • Coincident indicators rebound from July stall
      • China'a Recent Rebound In Detail
      • Conservative Economic Thought: 0 for 3 The Last Fi...
      • Keep an Eye On Oil
      • Market/Economic Analysis: US
      • Breaking bad thoughts
      • A thought for Sunday: Millenials and the emerging...
      • Weekly Indicators: Manufacturing and transport bre...
      • Why America Is Not the Greatest Country Anymore
      • Retail sales un-stagnate
      • Wherein I nit-pick Profs. Paul Krugman and Mark Th...
      • Chinese Economy and Market Rebounding
      • Five Years After The Collapse ....
      • Actually, it's Republican Leadership That Is Causi...
      • Canada Continues Its Economic Doldroms
      • The UK Is Printing Strong Economic Numbers
      • Median family income continued stagnation in 2012
      • The Moderate Expansion Continues; ISM Adds Bullish...
      • The Latin America Sell-Off Is Consolidating Losses
      • Oil Becoming Potential Major Economic Threat
      • The gaping hole in the jobs recovery is manufacturing
      • Market/Economic Analysis: US
      • Weekly Indicators: paradigm shift edition
      • Weekend Weimar, Beagle and Pit Bull
      • One bit of good news in today's jobs report: avera...
      • August jobs report: yellow flag for the second mon...
      • More Evidence of a EU Recovery
      • Vehicle sales achieve pre-recession normal range
      • Initial jobless claims continue improving trend, s...
      • Brazil Prints Stronger Than Expected GDP Number; I...
      • Balance Sheet Recession About Over
      • More on demographics and median income
      • More On the ISM/GDP Relationship
      • Yen Continues Consolidation
      • Surprisingly strong ISM manufacturing
      • India Prints Weak GDP Number, Adding Further Downw...
      • US Economic/Market Analysis
      • Labor Day Humor: Star Trek verses Miley Cyrus
      • Weekly Indicators: Labor (consumers) spends, corpo...
    • ►  August (64)
Powered by Blogger.

About Me

Unknown
View my complete profile