Gas Prices

  • Subscribe to our RSS feed.
  • Twitter
  • StumbleUpon
  • Reddit
  • Facebook
  • Digg

Wednesday, 4 December 2013

Sorry, Doomers, there really, truly, honestly, STILL is no second US housing bubble

Posted on 09:00 by Unknown

 - by New Deal democrat

The Census Bureau released September and October new home sales and median new house price data this morning, and that gives me a chance to update a post I wrote 6 months ago.

They reported that 444,000 new homes were sold in October,  which is just below June's 454,000 for the highest number of sales since the Great Recession.  September sales were only 354,000, however, which was the lowest since April of 2012.  In general, sales as reported look to be going sideways.  I suspect that increased mortgage rates will continue to pressure the housing market, and it will be interesting to see if October's blowout housing permits report is an outlier for a flattening or decreasing trend or not.

The Census Bureau also reports on median new house prices, however, and that gives me the perfect opportunity to finish off the debunking of the "second US housing bubble" claim that raised its head this past spring.

About 90% of all housing sold in the US is from existing sales.  Only about 10% of houses sold are new houses.  Back in June, I debunked a dishonest Zero Hedge graph that divided nominal increases in house prices by inflation-adjusted disposable income, predictably showing that, so measured, house prices were even higher than at the height of the housing bubble.  Of course, it turned out that when you did the honest comparison, i.e., nominal-to-nomial or real-to-real, there was no bubble at all.

But the Political Calculations blog was doing a real-to-real comparison of new homes, and there there had been a run-up in late 2012 to April 2013 in prices to near the 2005-06 peak.  I suspected it was a short-term phenomenon and not a real bubble, or at best a "minibubble" that would shortly be reversed.

And indeed we now have confirmation that neither new nor existing median house prices in the US have formed any kind of bubble at all.

First of all, let's look at the Case Shiller 20 city index.  In the below graph I have deflated the raw price data by average hourly income (blue) and by consumer inflation (red):

Photobucket Pictures, Images and Photos

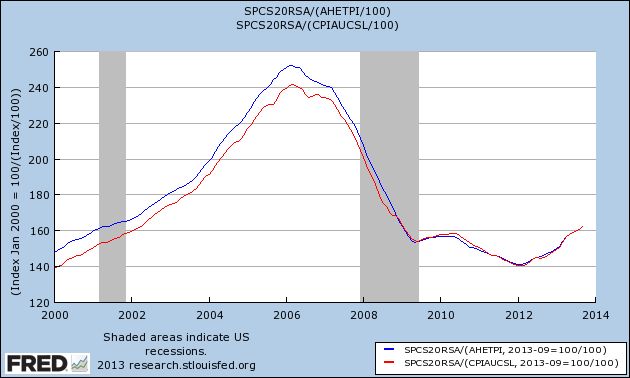
As you can see, existing houses are selling at the price levels they were at in 2001 or 2002, a far cry from the top of the bubble.  In fact, since 2009 the general trend is pretty flat.  Yes there has been a rebound, and it's certainly possible that the rebound has overshot a little, but this looks nothing like a bubble.

Now let's turn to median new house prices.  As measured over 50 years, and once again deflated by average wages (blue) and consumer prices (red) there has been an increase in new home prices:

Photobucket Pictures, Images and Photos

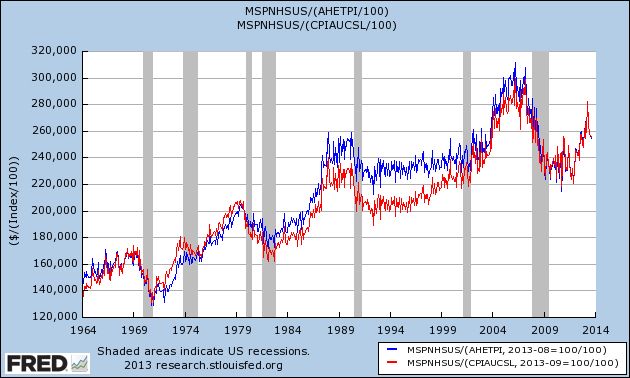
But it's well to keep in mind that the average square footage of a new house increased by something like 25% from 1600 s/f to 2000 s/f over that period.  So on a square-foot basis, the overall trend is probably closer to flat.

Further. in the long graph we can see the bubble forming in the early 2000's and then deflating, before rising again to near its former peak in 2012.

Now here is the same data in close-up, better to show the recent trend (note:  this does not include this morning's October report showing a median price of $245,800):

Photobucket Pictures, Images and Photos

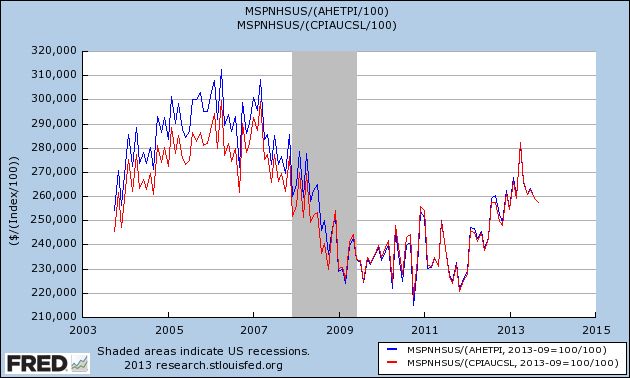
And with this morning's release of new home data we can see that the late 2012/early 2013 run-up in prices has entirely been given back.  In fact, the median house price in October 2013 was $1400 lower than October of 2012, even before taking average wage growth of about 2% or inflation of 1% into account.

Keep in mind that the same Doomers who are telling you now that there is a housing bubble are the same Doomers who predicted foreclosure tsunamis that never arrived, and that housing prices wouldn't bottom in early 2012.  On the other hand,  besides yours truly who called both the top of the bubble as it happened and in summer 2011 that the bottom of the bust would occur in the early months of 2012, three other people who have a, shall we say, pretty decent record in calling the housing market -  Bill McBride a/k/a Calculated Risk, Nobel Prize winner Robert Shiller, and Fed Chair nominee Janet Yellen - all agree with me that there is no new US housing bubble now.

Sorry, Doomers.  But keep at it, some day things will turn down again.


Email ThisBlogThis!Share to XShare to Facebook
Posted in | No comments
Newer Post Older Post Home

0 comments:

Post a Comment

Subscribe to: Post Comments (Atom)

Popular Posts

  • Median family income continued stagnation in 2012
    - by New Deal democrat Berkeley Professors Saez and Piketty have updated their work on family income in the US through 2012, making use o...
  • Initial claims last week ex-California computer glitch ~327,000
    - by New Deal democrat Computer issues in California continue to bedevil the weekly initial jobless claims reports. We can make a good es...
  • Oil Becoming Potential Major Economic Threat
    Oil is quickly becoming a potential major threat to the economy. Oil hit resistance at the 98 level five times during the first half of 2013...
  • An NDD holiday special: semi-healthy pecan pie with maple, caramel, and peanut butter
     - by New Deal democrat My mom made a  terrific pecan pie.  Unfortunately, most pecan pie recipes basically consist of corn syrup, sugar, an...
  • Weekend Weimar, Beagle and Pit Bull
    I'll be back on Monday; NDD will be here over the weekend.
  • A thought for Sunday: an undemocratically elected minority of anarchists
    - by New Deal democrat An old cynical political saw says that, "in a democracy, people get the government they deserve." As it ...
  • Why even debating breaching the debt ceiling is a Big F*g Deal: a nonpartisan note
    - by New Deal democrat Regardless of your politics, you should care very much not just whether or not we actually fail to increase the deb...
  • The Rising Yuan And Slowing Chinese Growth
    Above is a weekly chart of the yuan ETF over a three year period.  In the 2H09 and most of 2010 we see a relative level of stability, save f...
  • No Commodity Based Inflation in the Works
    Above is a weekly chart of the overall commodity index for the last three years.  While heavily weighted towards oil, other commodities are ...
  • 2014 forecast: a year of deceleration
       - by  New Deal democrat My method of foecasting is pretty simple. In fact, so simple, I call it the K.I.S.S. method. Even though the LEI ...

Categories

  • Australia
  • Auto
  • Brazil
  • Canada
  • Chile
  • China
  • CPI
  • employment
  • Europe
  • GDP
  • Germany
  • India
  • Investment
  • ism manufacturing
  • ISM Service
  • Japan
  • Mexico
  • PCE
  • Peru
  • PPI
  • UK

Blog Archive

  • ►  2014 (7)
    • ►  January (7)
  • ▼  2013 (293)
    • ▼  December (54)
      • International Economic Predictions for 2014
      • Marking my forecast for 2013 to market
      • Rethinking the EUR/USD Double Top Thesis
      • The Important economic trends of 2013
      • A thought for 2013: The Progressive Economic Case...
      • Weekly Indicators for December 23-27 at XE.com
      • International Economic Week in Review
      • OH NOES!!! So far in the year of Obamacare implem...
      • Year-end posting
      • An updated look at the real personal savings rate
      • Chinese Debt Levels Reaching Concerning Levels
      • Santa had a very rough night ...
      • Double Top For EUR/USD? [Link Fixed]
      • One graph shows why the present stinks (and why th...
      • The Long-Term Pound/Yen Chart is Very Bullish
      • Weekly Indicators for December 16-20 at XE.com
      • International Week In Review: Let the Tapering Begin
      • Weekend Weimar and Beagle
      • Yesterday's poor initial jobless claims report: so...
      • Interest rates' effect on housing in 2014
      • What Will Be the Biggest International Economic St...
      • Latest UK Employment News is Pound Bullish
      • Subdued inflation takes average wages to near 3 ye...
      • The Big International Economic Events of 2013
      • Industrial production now higher than before reces...
      • France Holding Back EU Recovery
      • An NDD holiday special: semi-healthy pecan pie ...
      • International Week in Review: China Still Growing,...
      • Weekly Indicators for December 9-13 at XE.com
      • Unemployment: positive and improving, but not good
      • US Consumers Remarkably Resilient
      • A note about today's initial jobless claims and re...
      • US Dollar Still In An Uptrend Verses the Canadian ...
      • An updated look at the US long leading indicators
      • Pound is Breaking Out Thanks To Strong UK Economic...
      • Oil Rebounds From Recent Lows
      • < Sigh > If only there were a way to count people...
      • Longer Term US Charts Still Bullish
      • A thought for Sunday: Why stagnant wages and trend...
      • Weekly Indicators for December 2-6 at XE.com
      • International Week in Review: Central Bank Holding...
      • On Social Security, "doing nothing" is the best op...
      • November jobs report: a solid positive month (but ...
      • ISM Report Shows Potentially Strong Economy
      • US Employment Is Still Weak
      • Pensions and Bankruptcy: a fix is available and sh...
      • Sorry, Doomers, there really, truly, honestly, STI...
      • French and Italian ETFs Trading Right At Support
      • ISM manufacturing suggests above trend GDP growth,...
      • US Yield Curve Is Widening
      • Potential Housing Bubble Keeps the Reserve Bank of...
      • British Pound is Rallying
      • The anatomy of median wage stagnation: paltry wag...
      • Junk Bond ETF Breaking Out on Daily Chart
    • ►  November (38)
    • ►  October (58)
    • ►  September (79)
    • ►  August (64)
Powered by Blogger.

About Me

Unknown
View my complete profile