Gas Prices

  • Subscribe to our RSS feed.
  • Twitter
  • StumbleUpon
  • Reddit
  • Facebook
  • Digg

Friday, 20 December 2013

Yesterday's poor initial jobless claims report: some signal buried in the snow of seasonal noise?

Posted on 06:37 by Unknown

 - by New Deal democrat

Yesterday's surprisingly poor initial jobless claims report of 379,000 was certainly a head-scratcher.  I didn't see any obvious explanations.  At the same time, coming in the middle of the holiday season,  only two weeks after a 298,000 report, and with no other economic data showing any serious signs of tanking, my inclination is to treat it as noise and wait to see if a few more weeks sorts the matter out.


But let's go deep into the weeds for this one.

To begin with, December seasonal adjustments can be huge.  Here's a graph of non-seasonally adjusted initial jobless claims divided by seasonally adjusted claims for the last 10 years:

Photobucket Pictures, Images and Photos

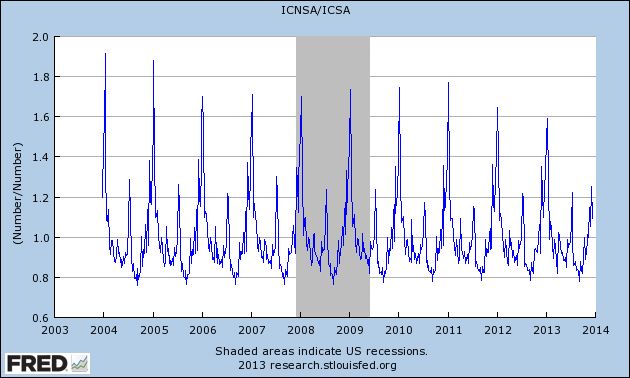
It's pretty easy to see that we are at the time of year when the largest seasonal adjustments of the year take place.

Not only that, but the variation just from week to week can be large.  For example, the adjustment in the previous week was ~0.80.  Last week it was ~0.92.  Had the previous week's seasonal adjustment been used, jobless claims would only have been reported at 331,000!

Even for this reference week, which creeps by a day or two YoY, the adjustments can vary substantially.  This year's 0.92 is the smallest adjustment for the reference week in the last 10 years.  Last week it was 0.91, but in 2004, 2005, and 2009 the average of the two closest reference weeks was 0.85 - which would give us a report of 343,000.  In other recent years, it would have been higher than 343,000 but lower than 375,000.

None of this is to fault the DOL,  The point is simply that seasonal adjustments are particularly prone to noise at this time of year.

Other evidence that seasonality may be playing havoc with the claims number comes from the fact that, as I've said a number of times before, weakness starts with a slowdown in hiring before there is an increase in firing, i.e., hiring precedes firing.  Below is an update of a scatterplot graph I've run before comparing the monthly jobs report (net hiring) with the monthly average of new jobless claims (firing), in which the last 20 months are highlighted in red:

Photobucket Pictures, Images and Photos

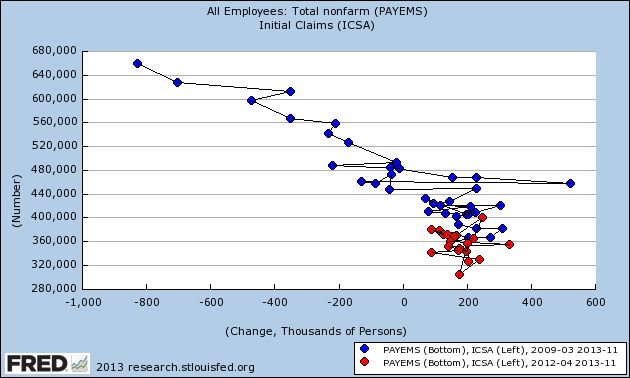
Before a recession, the scatterplot points shift significantly to the left.  But as you can see from the above, while the points have stagnated, there has been no significant shift to the left in recent reports.

Further evidence of the relative strength in hiring comes from this graph of the YoY% change in jobs, which has been showing a slight increase during this year:

Photobucket Pictures, Images and Photos

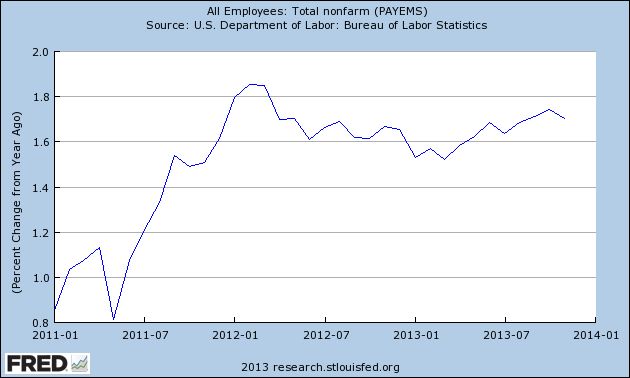
This is simply not something I would expect if we were on the cusp of a near-recession.

Also, even if there is "signal," it still may be affected by the season.  Last year, due to tax shifting, there was a huge spike in personal income in November and December.  That was reflected in large gains in the 14 day average of Gallup's daily consumer spending report, which ramped up from $65 in November to $90 in December 2012.  This year in the equivalent period spending has only increased from about $87 to $100 at its peak so far.

What follows is my best guess, so take it with appropriate grains of salt, but if retailers mistakenly expected a similar ramping up this year, they have been sorely disappointed.  Not to mention, in many parts of the country there have been some unusually significant December winter storms, which kept shoppers home.  Those retailers may have begun layoffs of seasonal hires early, which would have a heightened impact on the jobless claims reports.

The bottom line is, while it looks like some actual signal (in most years, even with the seasonal adjustment, the number would have been reported as 350,000 or more), there is an excellent chance that this week's jobless report is still primarily seasonal noise.

Email ThisBlogThis!Share to XShare to Facebook
Posted in | No comments
Newer Post Older Post Home

0 comments:

Post a Comment

Subscribe to: Post Comments (Atom)

Popular Posts

  • Median family income continued stagnation in 2012
    - by New Deal democrat Berkeley Professors Saez and Piketty have updated their work on family income in the US through 2012, making use o...
  • Initial claims last week ex-California computer glitch ~327,000
    - by New Deal democrat Computer issues in California continue to bedevil the weekly initial jobless claims reports. We can make a good es...
  • Oil Becoming Potential Major Economic Threat
    Oil is quickly becoming a potential major threat to the economy. Oil hit resistance at the 98 level five times during the first half of 2013...
  • An NDD holiday special: semi-healthy pecan pie with maple, caramel, and peanut butter
     - by New Deal democrat My mom made a  terrific pecan pie.  Unfortunately, most pecan pie recipes basically consist of corn syrup, sugar, an...
  • Weekend Weimar, Beagle and Pit Bull
    I'll be back on Monday; NDD will be here over the weekend.
  • A thought for Sunday: an undemocratically elected minority of anarchists
    - by New Deal democrat An old cynical political saw says that, "in a democracy, people get the government they deserve." As it ...
  • Why even debating breaching the debt ceiling is a Big F*g Deal: a nonpartisan note
    - by New Deal democrat Regardless of your politics, you should care very much not just whether or not we actually fail to increase the deb...
  • The Rising Yuan And Slowing Chinese Growth
    Above is a weekly chart of the yuan ETF over a three year period.  In the 2H09 and most of 2010 we see a relative level of stability, save f...
  • No Commodity Based Inflation in the Works
    Above is a weekly chart of the overall commodity index for the last three years.  While heavily weighted towards oil, other commodities are ...
  • 2014 forecast: a year of deceleration
       - by  New Deal democrat My method of foecasting is pretty simple. In fact, so simple, I call it the K.I.S.S. method. Even though the LEI ...

Categories

  • Australia
  • Auto
  • Brazil
  • Canada
  • Chile
  • China
  • CPI
  • employment
  • Europe
  • GDP
  • Germany
  • India
  • Investment
  • ism manufacturing
  • ISM Service
  • Japan
  • Mexico
  • PCE
  • Peru
  • PPI
  • UK

Blog Archive

  • ►  2014 (7)
    • ►  January (7)
  • ▼  2013 (293)
    • ▼  December (54)
      • International Economic Predictions for 2014
      • Marking my forecast for 2013 to market
      • Rethinking the EUR/USD Double Top Thesis
      • The Important economic trends of 2013
      • A thought for 2013: The Progressive Economic Case...
      • Weekly Indicators for December 23-27 at XE.com
      • International Economic Week in Review
      • OH NOES!!! So far in the year of Obamacare implem...
      • Year-end posting
      • An updated look at the real personal savings rate
      • Chinese Debt Levels Reaching Concerning Levels
      • Santa had a very rough night ...
      • Double Top For EUR/USD? [Link Fixed]
      • One graph shows why the present stinks (and why th...
      • The Long-Term Pound/Yen Chart is Very Bullish
      • Weekly Indicators for December 16-20 at XE.com
      • International Week In Review: Let the Tapering Begin
      • Weekend Weimar and Beagle
      • Yesterday's poor initial jobless claims report: so...
      • Interest rates' effect on housing in 2014
      • What Will Be the Biggest International Economic St...
      • Latest UK Employment News is Pound Bullish
      • Subdued inflation takes average wages to near 3 ye...
      • The Big International Economic Events of 2013
      • Industrial production now higher than before reces...
      • France Holding Back EU Recovery
      • An NDD holiday special: semi-healthy pecan pie ...
      • International Week in Review: China Still Growing,...
      • Weekly Indicators for December 9-13 at XE.com
      • Unemployment: positive and improving, but not good
      • US Consumers Remarkably Resilient
      • A note about today's initial jobless claims and re...
      • US Dollar Still In An Uptrend Verses the Canadian ...
      • An updated look at the US long leading indicators
      • Pound is Breaking Out Thanks To Strong UK Economic...
      • Oil Rebounds From Recent Lows
      • < Sigh > If only there were a way to count people...
      • Longer Term US Charts Still Bullish
      • A thought for Sunday: Why stagnant wages and trend...
      • Weekly Indicators for December 2-6 at XE.com
      • International Week in Review: Central Bank Holding...
      • On Social Security, "doing nothing" is the best op...
      • November jobs report: a solid positive month (but ...
      • ISM Report Shows Potentially Strong Economy
      • US Employment Is Still Weak
      • Pensions and Bankruptcy: a fix is available and sh...
      • Sorry, Doomers, there really, truly, honestly, STI...
      • French and Italian ETFs Trading Right At Support
      • ISM manufacturing suggests above trend GDP growth,...
      • US Yield Curve Is Widening
      • Potential Housing Bubble Keeps the Reserve Bank of...
      • British Pound is Rallying
      • The anatomy of median wage stagnation: paltry wag...
      • Junk Bond ETF Breaking Out on Daily Chart
    • ►  November (38)
    • ►  October (58)
    • ►  September (79)
    • ►  August (64)
Powered by Blogger.

About Me

Unknown
View my complete profile